Rich getting richer, Poor getting poorer in India
Last Updated: 10 Dec 2023
“India is among the most unequal countries in the world, with rising poverty and an ‘affluent elite’” -World Inequality Report, 2022[1]
"Inequality is a political choice, not an inevitability" -World Inequality Report, 2022[1:1]
¶ Current Status (Based on 2021 Data)[2]
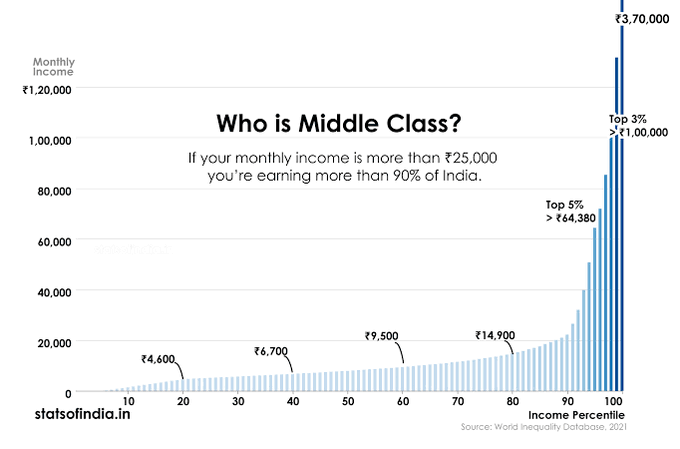
If you earn Rs 25,000/month, you are among Top 10% Indians
- Top 1% earns more than Rs.3,70,000 a month
- Top 3% - Rs.1,00,000
- Top 5% - Rs.64,380
¶ Annual household income 2021 vs 2016 (@2011-12 prices)[3]
| Population slabs based on per capita income* % | Growth over 5 years | |
|---|---|---|
| Q1 | Poorest 20% slab | -53% |
| Q2 | Lower Middle 20% slab | -32% |
| Q3 | Middle 20% slab | -9% |
| Q4 | Upper Middle 20% slab | +7% |
| Q5 | Richest 20% slab | +39% |
| All India Avg Household Income | 8% |
Reference Period is April 2015 to March 2016
Reference Period is April 2020 to March 2021
¶ Wealth Ownership[4][1:2]
Out of the total wealth created in India, from 2012 to 2021
- 40% gone to just 1%
- 3% only went to bottom 50%
Gautam Adani has seen wealth soar by $42 billion (46 percent) in 2022 alone
¶ Corporate vs Household income[4:1][1:3]
Corporate Income: +70% increase
Households: 84% saw a decline
-2021-22 compared to the previous year
The total number of billionaires in India increased from 102 in 2020 to 166 billionaires in 2022
¶ Increased tax on Poor, burden shifted from Corporate/Rich
Details in a separate article: AAP Wiki: Taxing Poor More, Less on Rich
¶ Hungry Indians Rising
Details in a separate article: AAP Wiki: Rise in Hungry Indians
References:
https://d1ns4ht6ytuzzo.cloudfront.net/oxfamdata/oxfamdatapublic/2023-01/India Supplement 2023_digital.pdf?kz3wav0jbhJdvkJ.fK1rj1k1_5ap9FhQ ↩︎ ↩︎ ↩︎ ↩︎
https://twitter.com/Stats_of_India/status/1527908454165143552 ↩︎
https://www.ice360.in/app/uploads/woocommerce_uploads/2022/02/annual-household-income-2021-vs-2016-2011-12-prices-7ieaq5.pdf ↩︎
Related Pages
No related pages found.